The challenge
The natural environment and human health, energy production and demand, infrastructure, food security and access to freshwater are vulnerable to variations in climate, and this vulnerability will keep increasing as climate will continue to change. Access to reliable seasonal forecasts has the potential to make society and the economy more resilient, sustainable and efficient in the face of climate variability and change.
RESILIENCE is an interactive climate service addressed to users from different sectors, such as energy, agriculture and water management. It provides a visual interface to explore probabilistic predictions of temperature, precipitation and wind conditions for the coming season.
The aim of RESILIENCE is to support users to better understand the future variability of climate variables and the provision of associated resources, and bridge the gap between the climate science community and practitioners from various socio-economic sectors.
Predicting the future variability of climate variables beyond the first two weeks allows users to take calculated, precautionary actions with potential cost savings. While for energy traders and wind farm managers understanding wind conditions in the next few months is crucial to estimate energy production and demand, farmers and wine producers could benefit from knowing how the grapes growing season will be to manage stocks accordingly. And these are just a few examples of the potential benefits.

So far, current practices in the energy, agriculture and water management sectors have relied on approaches based on historical observations (climatology). However, this methodology can be improved by probabilistic forecasts that build upon recent advances in global climate models (GCMs). GCMs are able to simulate the physical processes that govern the whole climate system and, unlike historical observations, predict events that had never occurred before, such as those entrained by climate change. Recent advances in climate science are creating an unprecedented potential to provide climate forecasts that go beyond the first two weeks, and span over the coming months, seasons and decades. Building on climate knowledge and information, climate services (EC, 2015) produce and apply tailored products for decision making in industry, policy and planning. Some projects such as EUPORIAS, CLIM4ENERGY and HIATUS, set out to develop fully working climate services prototypes that provide seasonal climate predictions tailored to specific requirements of users. Hence, the RESILIENCE prototype has been evolving within these projects.

Technical background
Data
The RESILIENCE prototype uses the 10-metre wind speed seasonal forecasts from the ECMWF System 4 (Molteni et al., 2011) and the 2-metre temperature and precipitation from the ECMWF System 5 operational seasonal prediction system (ECMWF, 2017). Predictions are validated with the corresponding surface wind speed, precipitation and temperature data from ERA-Interim (Dee et al., 2011) and JRA-55 (Kobayashi et al. 2015).
These atmospheric computations are sensitive to small variations in initial conditions, which can produce very different final outcomes. Besides, our knowledge of initial conditions is always imperfect as observations are discontinuous. For this reason, ensemble predictions (i.e. group of model simulations that use slightly different initial conditions and different realizations of stochastic representations of subgrid physical processes in the atmosphere) are used to estimate the multiple possible evolutions of the atmosphere-ocean system and the probabilities associated with them. The operational forecasts used in RESILIENCE are produced at the beginning of each month with 51 ensemble members in the case of wind speed data and 25 ensemble members for temperature and precipitation. The simulations are performed for up to seven months into the future.
Data processing: calibration and post-processing
Like any variable predicted in a coupled model, wind speed, temperature and precipitation are affected by biases resulting from the inability of the model to numerically reproduce all the relevant processes responsible from climate variability in a perfect way. ECMWF System 4 and ECMWF System 5 seasonal predictions require a post-processing stage for them to statistically resemble the observational reference and to minimise forecast errors. The RESILIENCE prototype performs this fundamental step to produce usable, tailored and high quality information ready to be included in the decision making processes of different sectoral users. See further details on how this has been done for seasonal predictions of wind speed.
Calibration can be considered as a way of obtaining predictions with average statistical properties similar to those of a reference data set. For such purpose, we have applied the variance inflation technique (von Storch, 1999). This modifies the predictions to have the same interannual variance as the reference dataset and corrects the underestimation or overestimation of the ensemble spread without modifying the ensemble-mean correlation.
The statistical post-processing parameters are determined by comparing the past forecasts with the observations which are based on the same dataset that is used for verification. Cross-validation estimates the corrected forecast by omitting the particular forecast to be corrected from the forecast average, i.e. all the available samples but the target season are used as training data, including years after the target season. This procedure is useful to emulate real-time forecast situations as closely as possible.
Skill: forecast quality assessment
The output of seasonal forecast systems, like for any other forecasting system, has to be systematically compared to a reference, preferably observations, to assess their overall quality in a multifaceted process known as forecast quality assessment (Mason and Stephenson, 2008). This is another crucial step into the prediction process because a prediction has no value without an estimate of forecasting skill based on past performance (Doblas-Reyes et al., 2013).
Skill estimates, based on the performance of the system in the past, inform users about the expected performance of future forecasts (Weisheimer and Palmer, 2014). Although there are different skill scoring measures, the Ranked Probability Skill Score (RPSS, see i.e. Wilks, 2011) is the one displayed in the RESILIENCE interface. RPSS is a squared measure comparing the cumulative probabilities of categorical forecast and observation vectors relative to a climatological forecast strategy. The individual observations in the verification time series can fall in any of the three categories with probability determined by the probability density function (PDF) for the target season.
RPSS ranges from 1 to −∞. Skill scores below 0 are defined as unskilful, those equal to 0 are equal to the climatology forecast, and anything above 0 is an improvement upon climatology, up to 1, which indicates a ‘‘perfect’’ forecast. See further technical details on skill assessment in quality assessment of climate predictions.
User Interface
The RESILIENCE interface is designed to be used by users from the energy, agriculture and water management sectors, who need to understand how climate variables will change in the coming months. The web application at http://resilience.bsc.es/ allows to spot global patterns and trends in future conditions, and drill into detailed prediction breakdowns on a regional level.

World map with data overlay
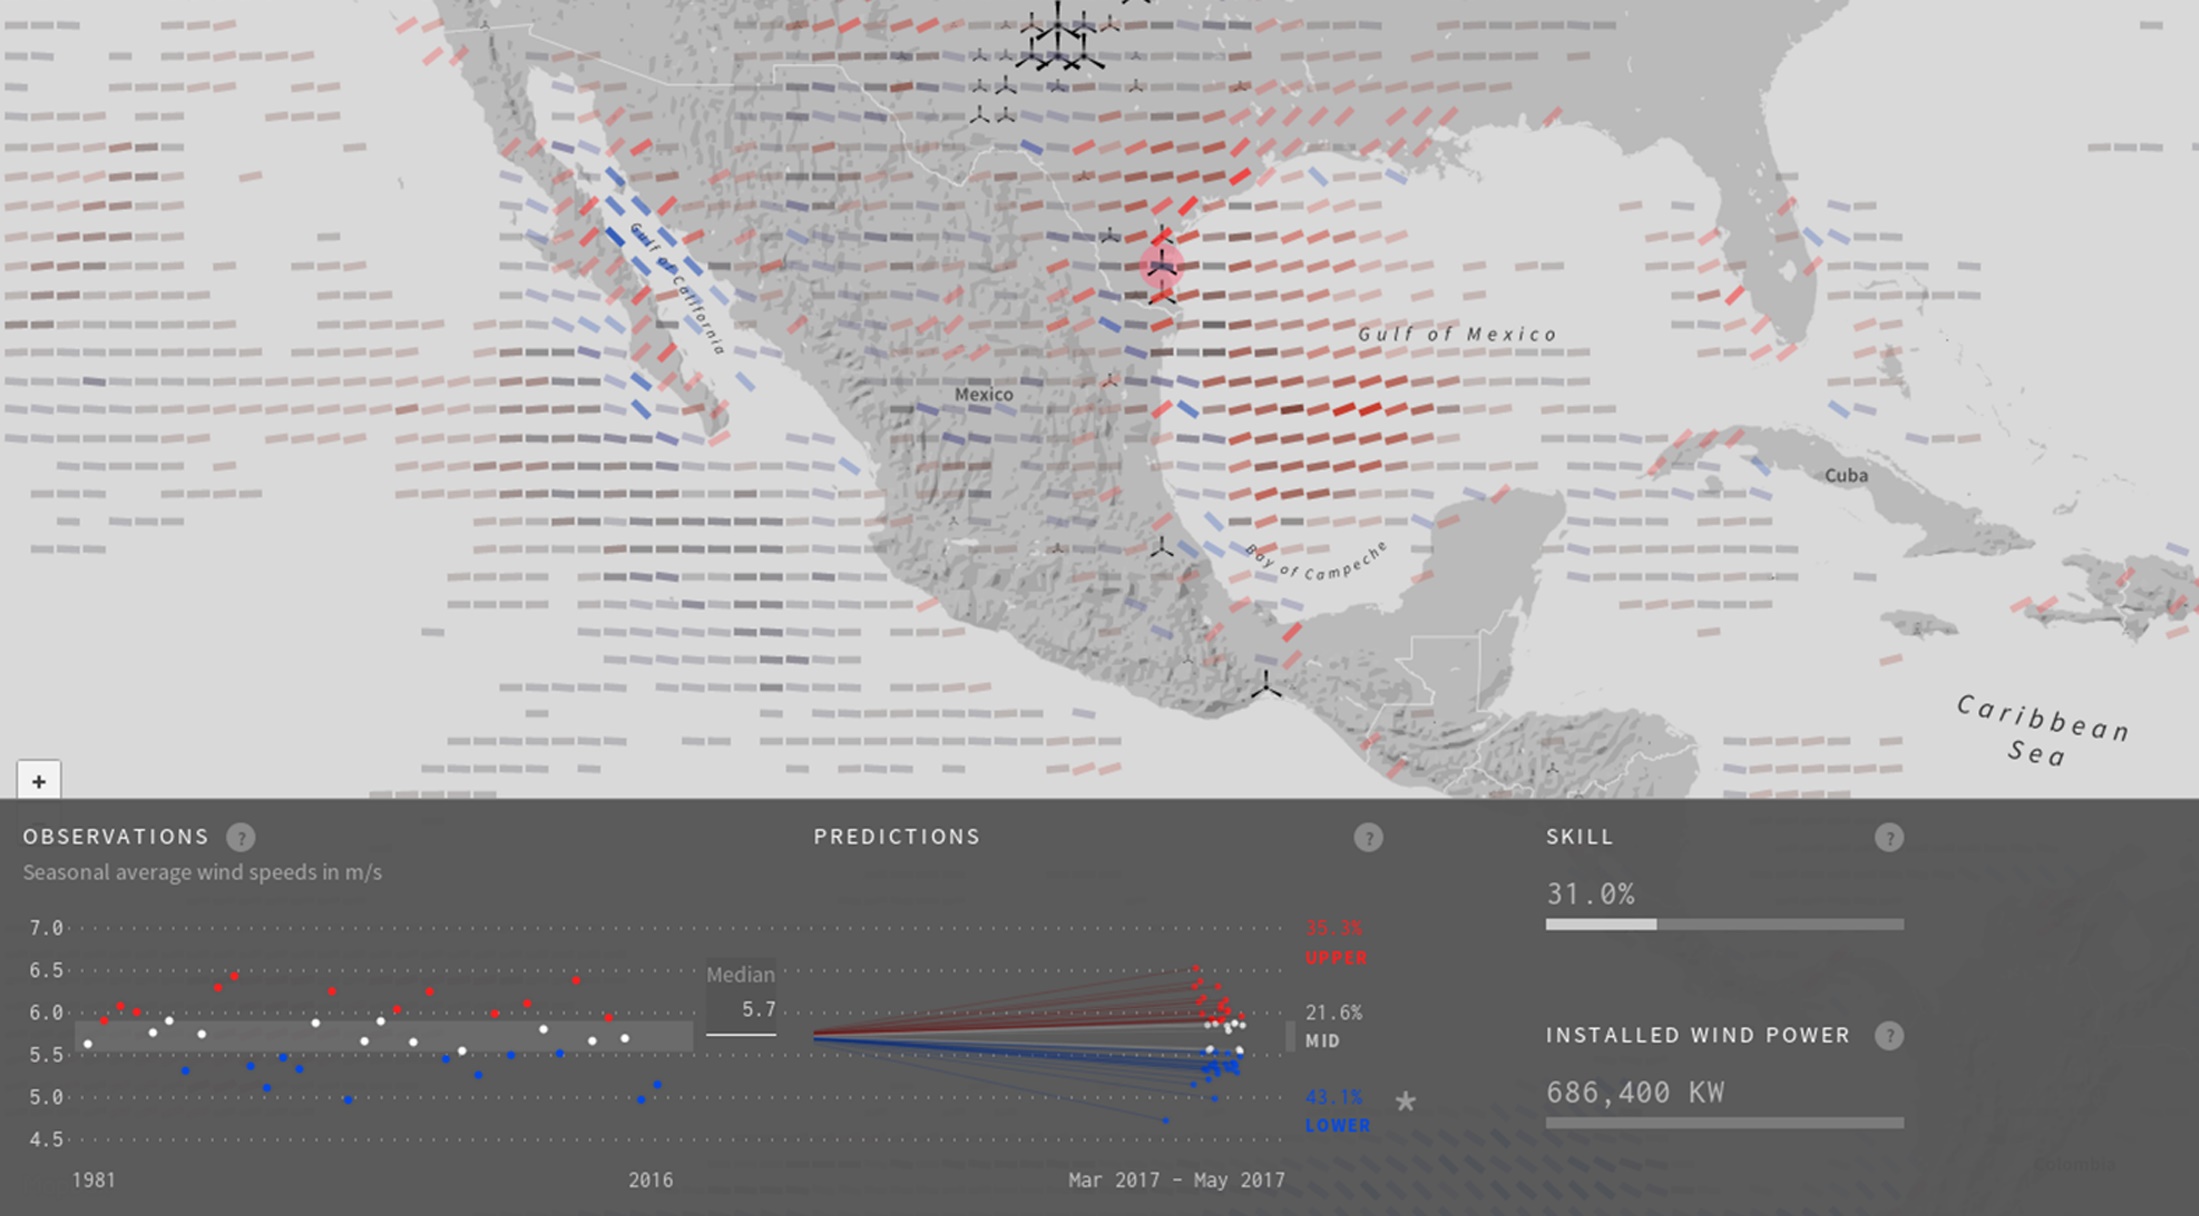
The user interface presents a thematic map with prediction data visualized in line symbols (multi-dimensional glyphs) for around 100,000 grid points covering the globe.
These encode a number of dimensions in parallel:
Prediction skill
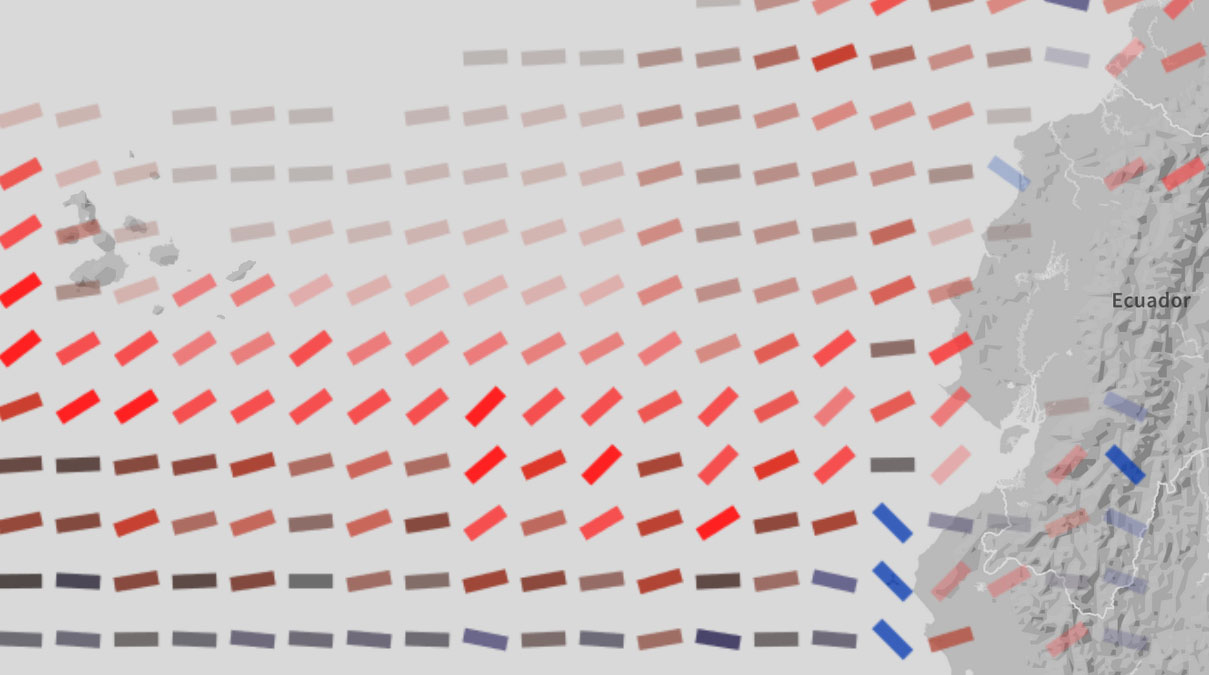
Indicating how well the prediction model performed in that region in the past (using historical data). It is expressed through opacity, where regions with higher skill values are more opaque, whereas regions with lower values are more transparent. To facilitate readability, the opacity values are binned into 4 discrete steps based on the quartiles of the skill distribution. Only lines that represent areas with skillful forecasts are visible. The legend allows to define the level of skill, hiding forecasts below a selected value.
Predicted anomaly
Represented by line tilt and color. Red lines pointing to the top right indicate a high probability of the variable to be above the average, whereas blue lines pointing bottom right show a high probability of the variable to be below the average (note that for the precipitation variable the color scale has been reversed). Encoding using line tilt and color (so-called redundant encoding) provides a good overview of the trend situation in zoomed out view, while in closer views, the tilt is readable more precisely.
This combined data display allows to immediately draw the viewer's attention to spots with strong indication of significant changes in wind speed.

Detail panel
Selecting a region on the map opens a panel with information on the past 30 years of observations of the variable of interest, the full distribution of the different prediction results computed and the detailed level of skill (quality of the prediction).

Observations plot
The observations plot summarises the mean observations of the variable in the selected region over the last 30 years (for the particular season). Each observation is color coded and split into three categories of equal size (terciles) that indicate if that season had low (blue), medium (white) or high (red) values for the variable of interest. Note that the colour scale for precipitation has been reversed, red indicating the lowest values and blue indicating the highest values.
Prediction plot
This diagram presents the predicted values of the different ensemble members obtained by the RESILIENCE prototype. These values comprise the calibrated probabilistic prediction for the selected region. The ensemble predictions are displayed as a cone of rays emanating from the typical (median) value of the historical data, allowing a quick judgement of variance among the predictions and the central tendency.
Skill
Skill scores are numerically represented in the chart as a percentage. A (hypothetical) score of 100% would indicate a perfect prediction and a score of 0% would indicate that the prediction is not better than just making a guess based on historical data. Predictions lower than zero (unskillful) are not displayed.
Installed Wind Power
In the case of the wind variable, a chart with the installed wind power reflecting the production capacity in the selected region is displayed (database kindly provided by windpower.net).